
Iakovos Papadakis
Sales manager · Europe and worldwide
papadakis@fravebot.com

Put the calipers away: automated crop registration in your sections.
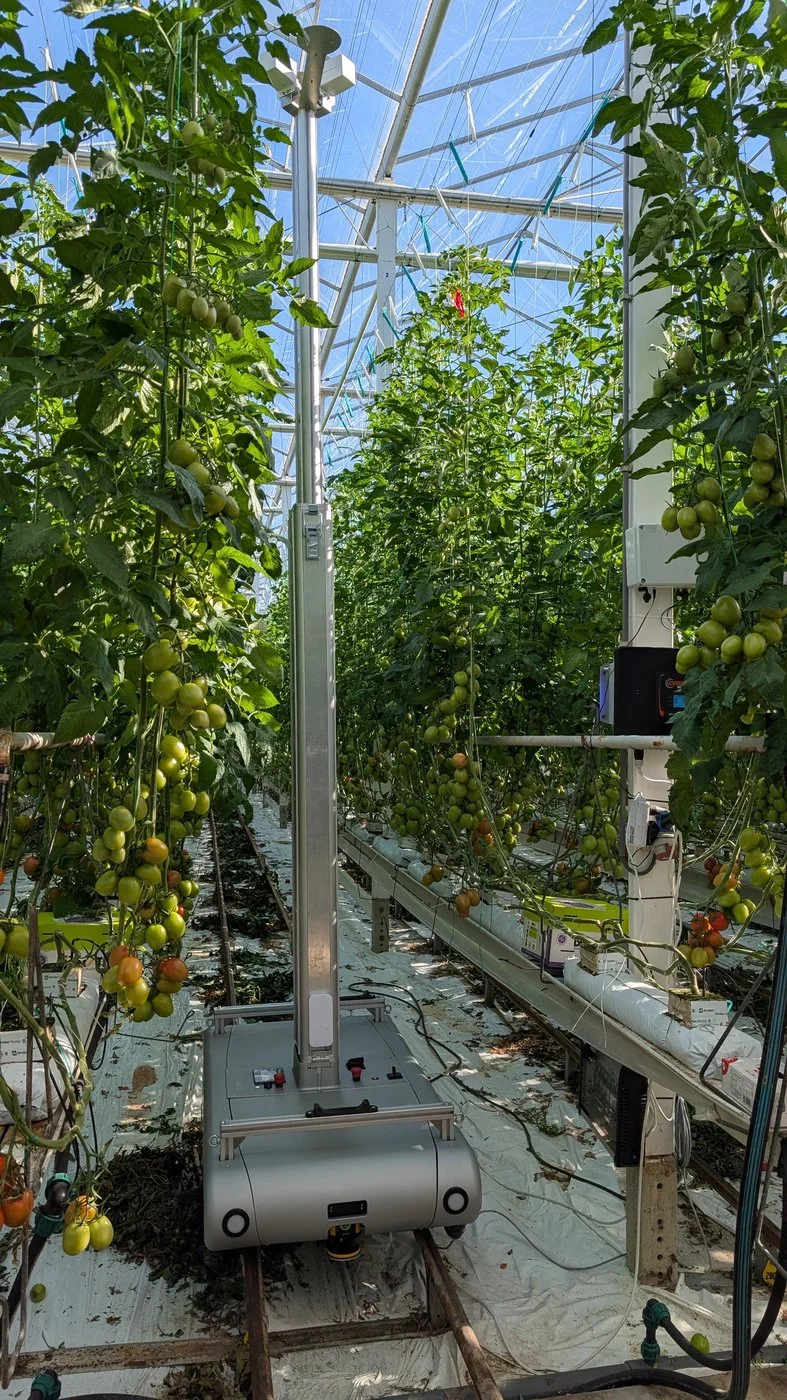
Your team measures a few tagged plants once a week. Scout measures every plant in the sections you choose, several times a day. Your tagged plants stay the reference.
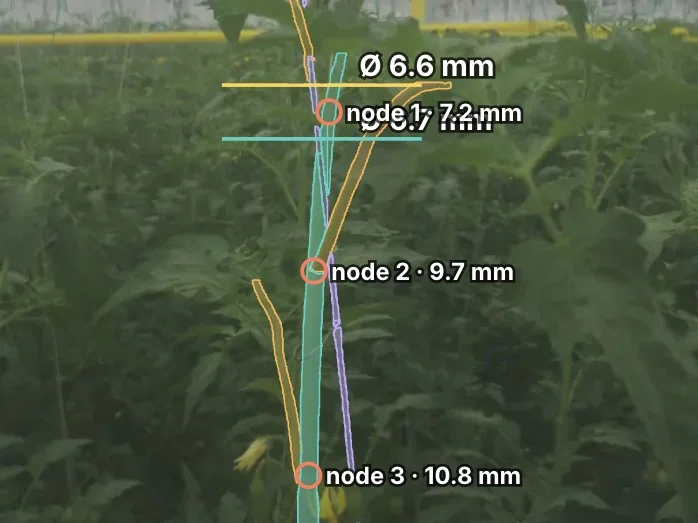 Row 280 · today
31 plants measured
6 passes · head, stem, nodes, flowers
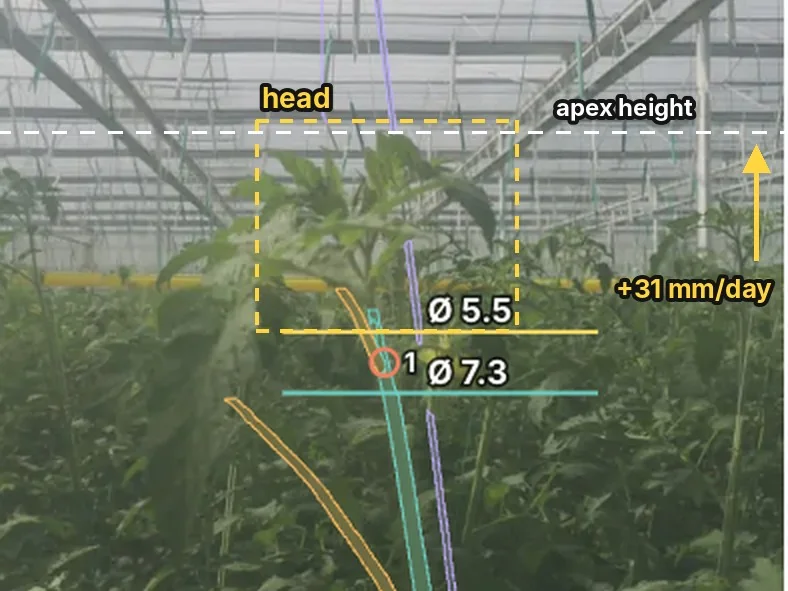
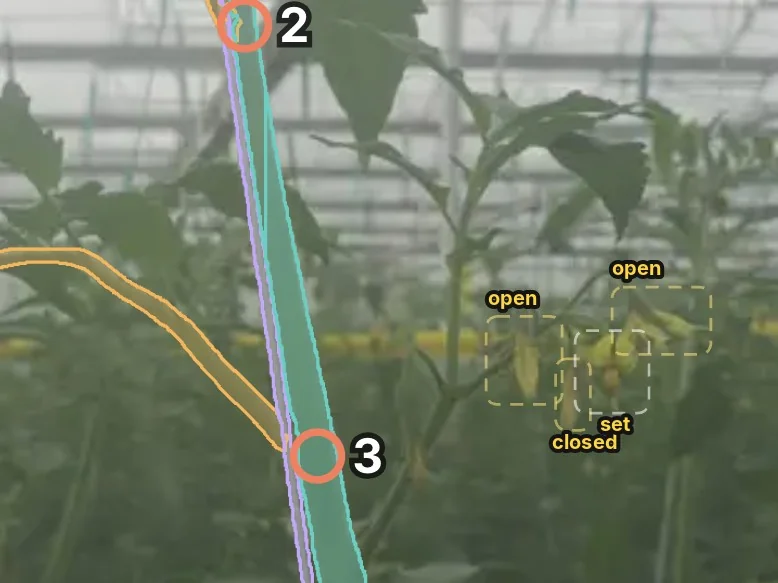
What it measures
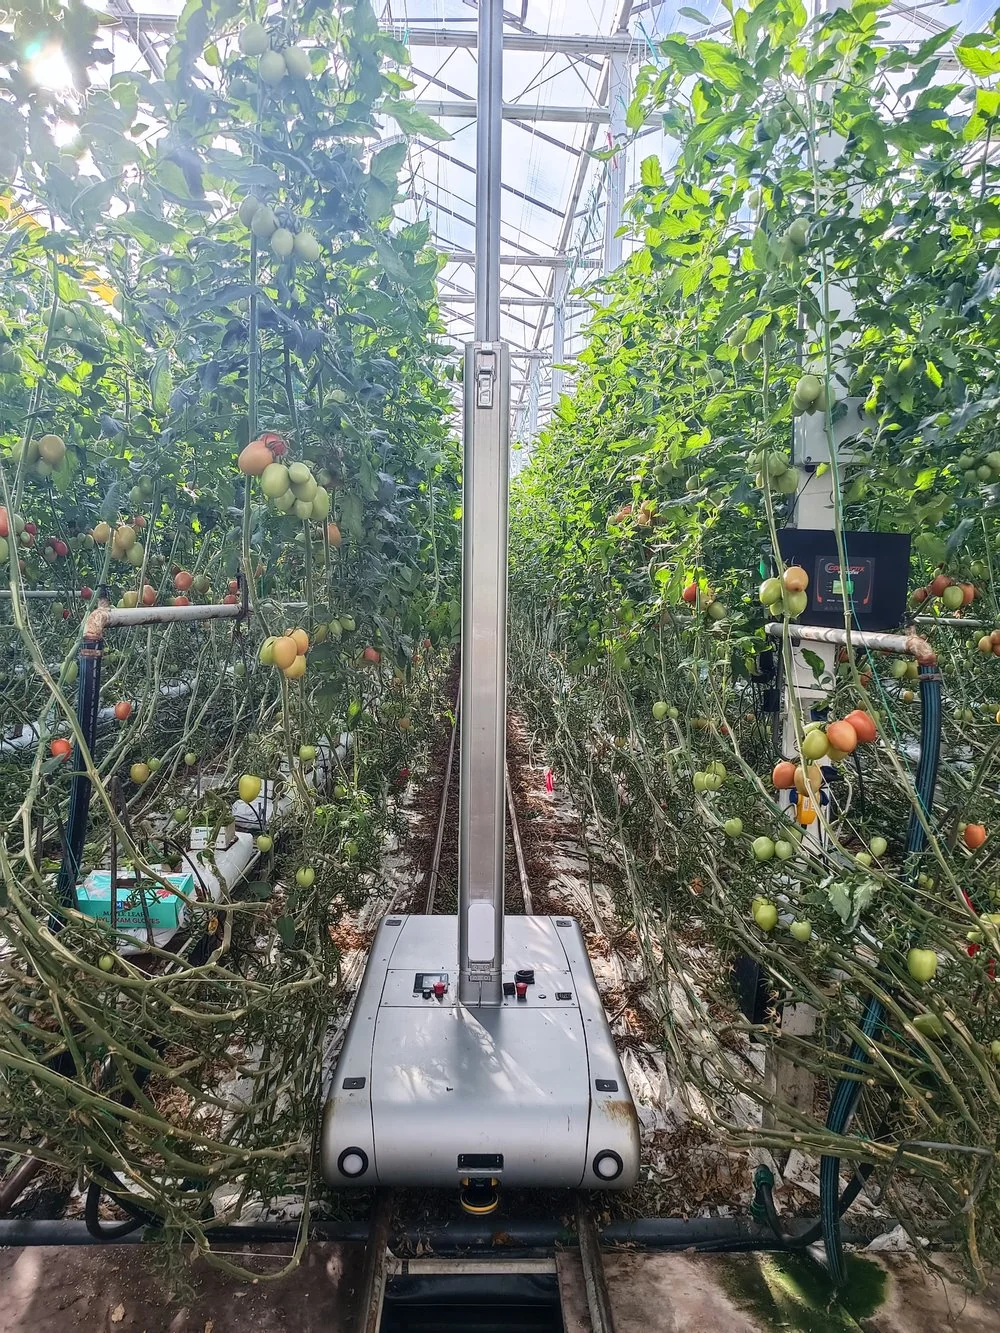
Measured sections · every day
Every plant measured the same way, every pass.
What you get
In the application
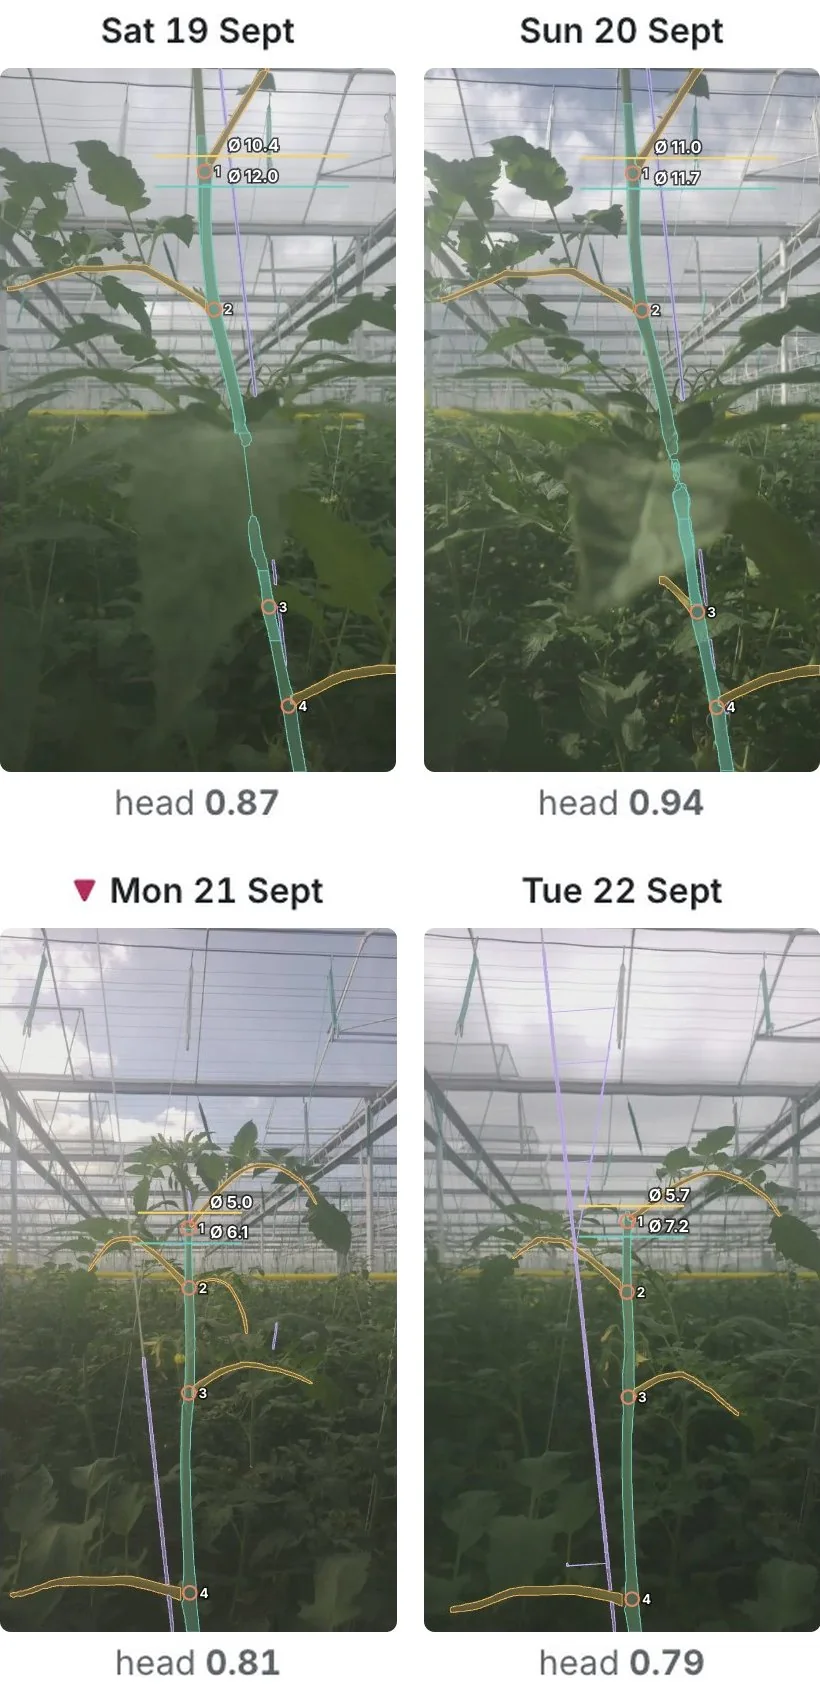
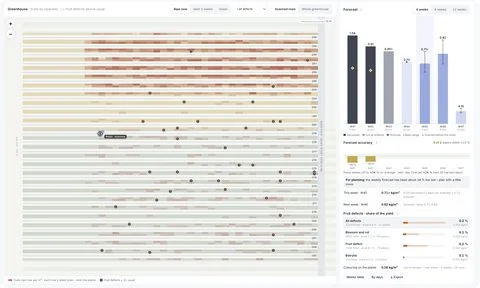
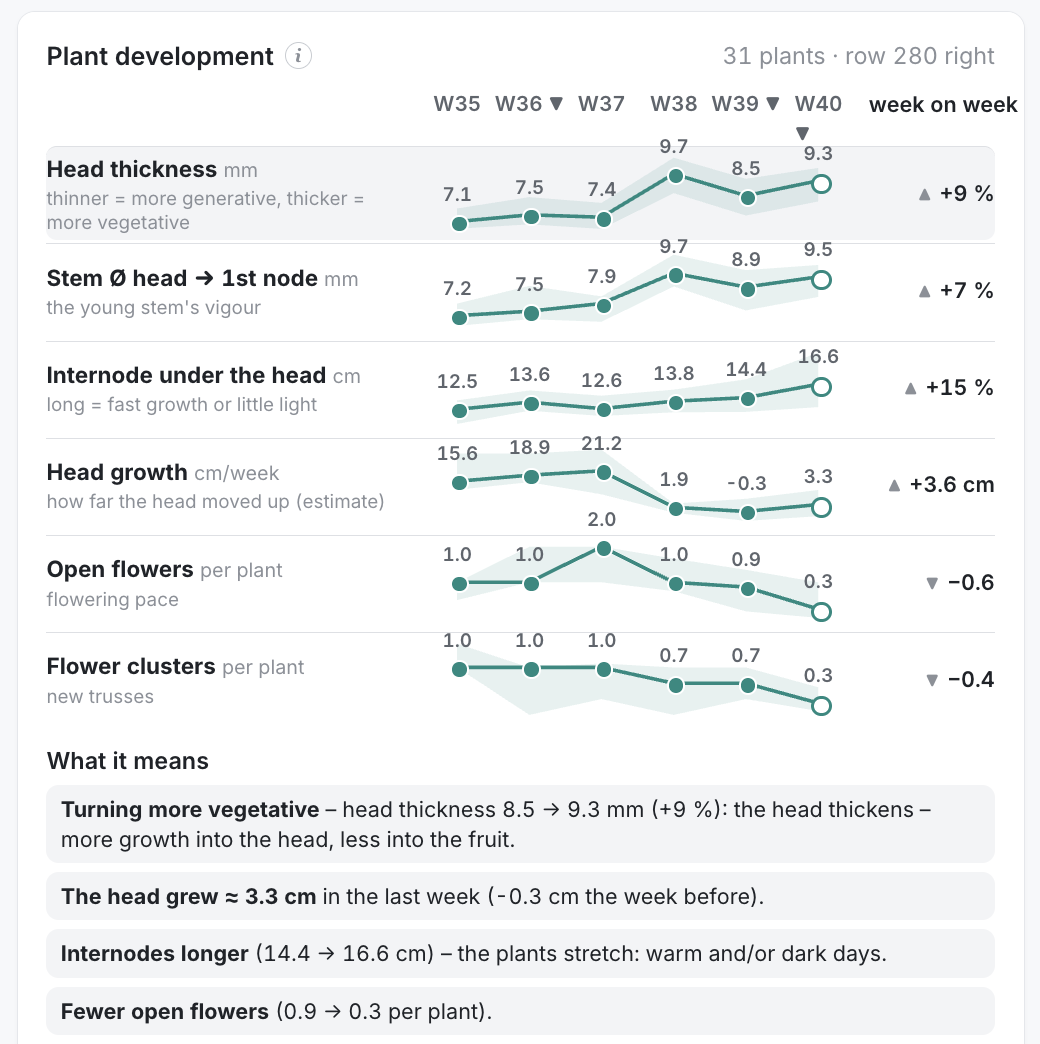
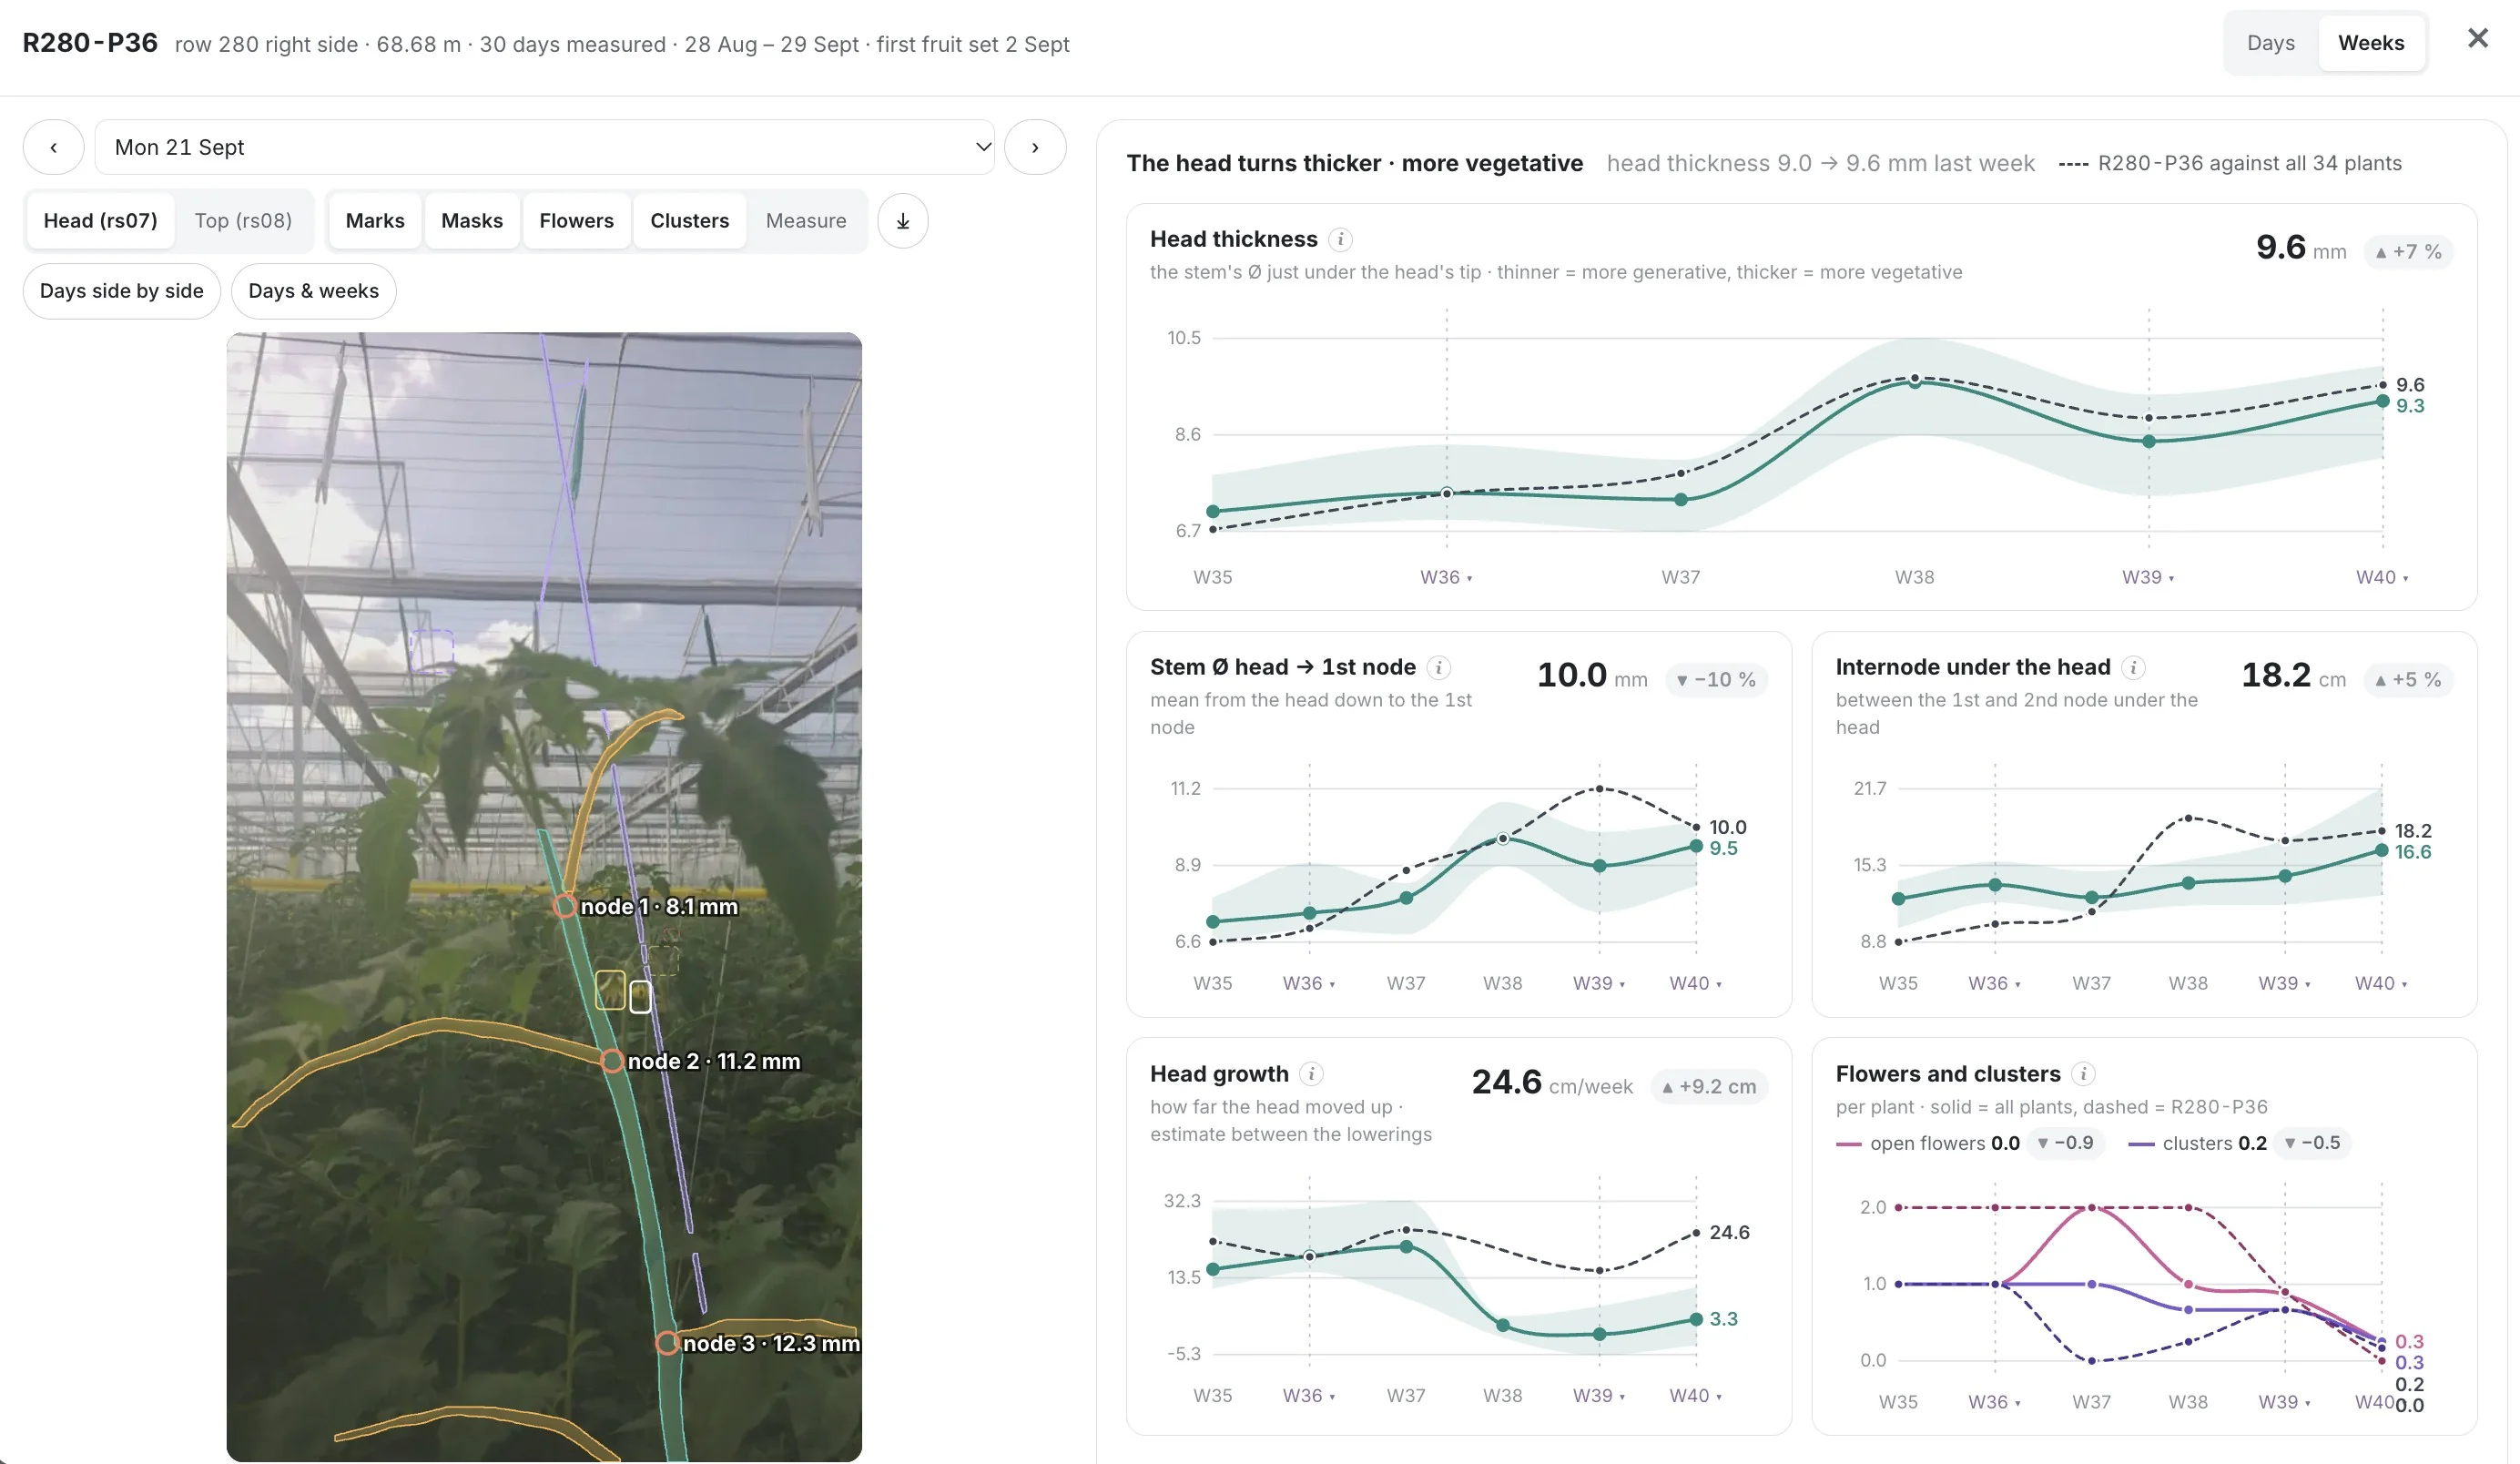
The weekly trend for each section, with a few plain sentences on what it means. Here the crop is turning vegetative: a thicker head, longer internodes, fewer flowers.
You see it the week it starts, not at the harvest.
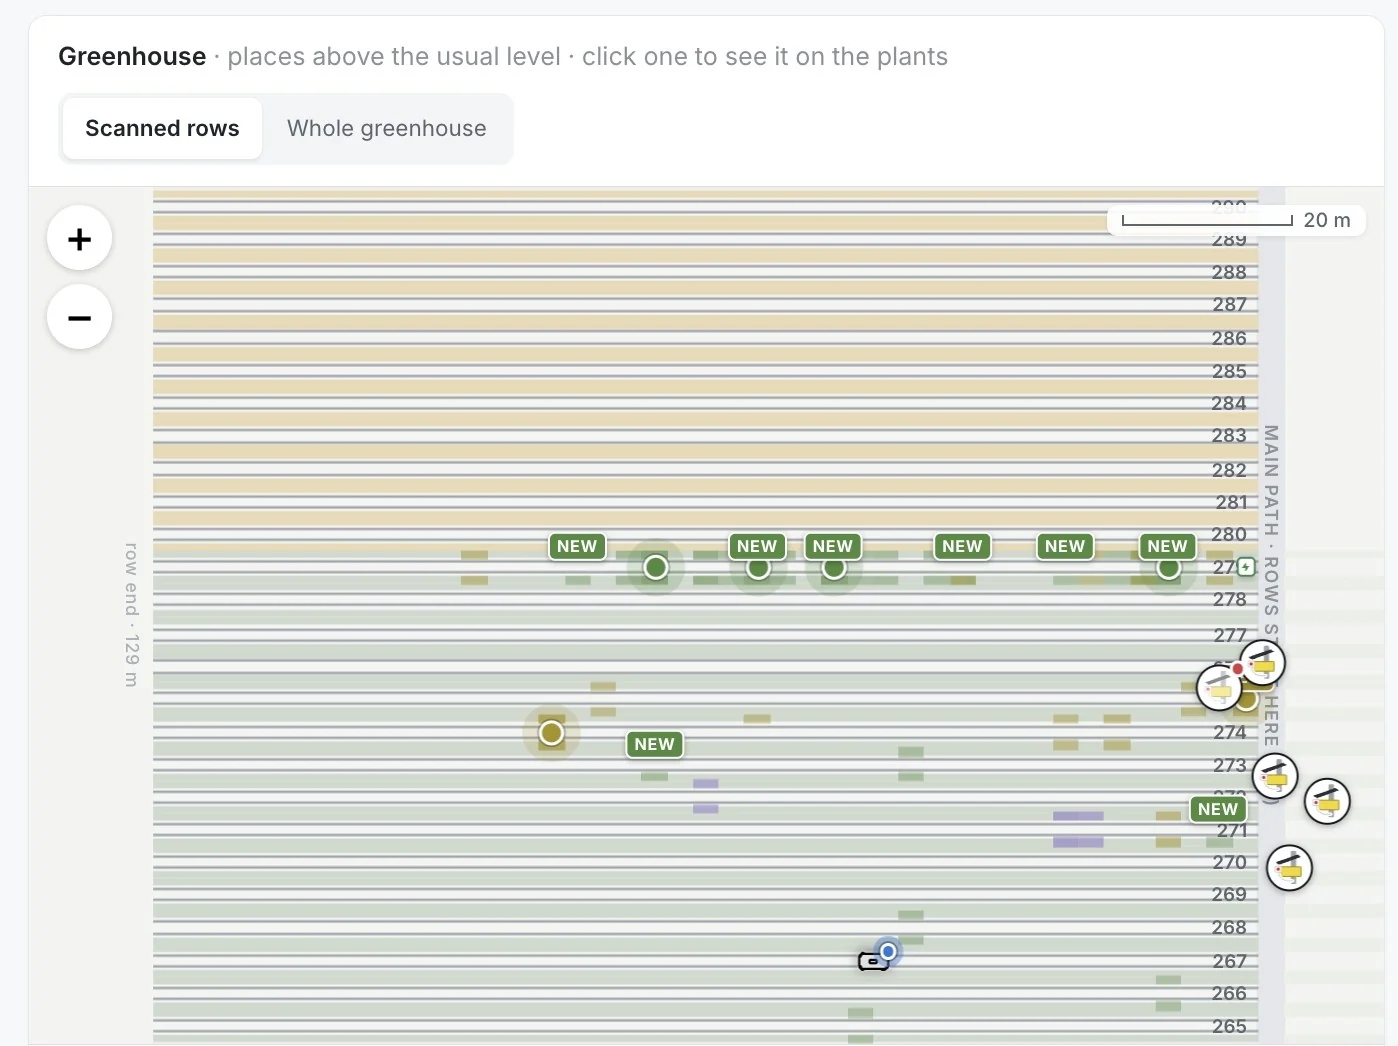
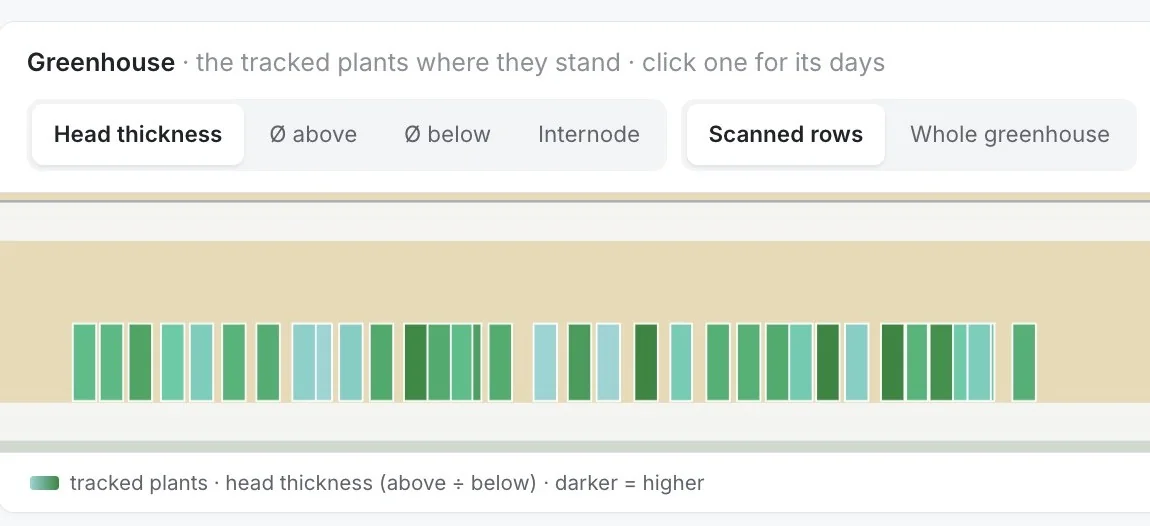
Measured plants where they stand, coloured by head thickness. Click one to open it.
How it works
Mark them on the greenhouse map: one spot or several, over as many rows as you like, typically next to the plants your team already registers by hand. Measuring is added to the same daily plan as scouting.
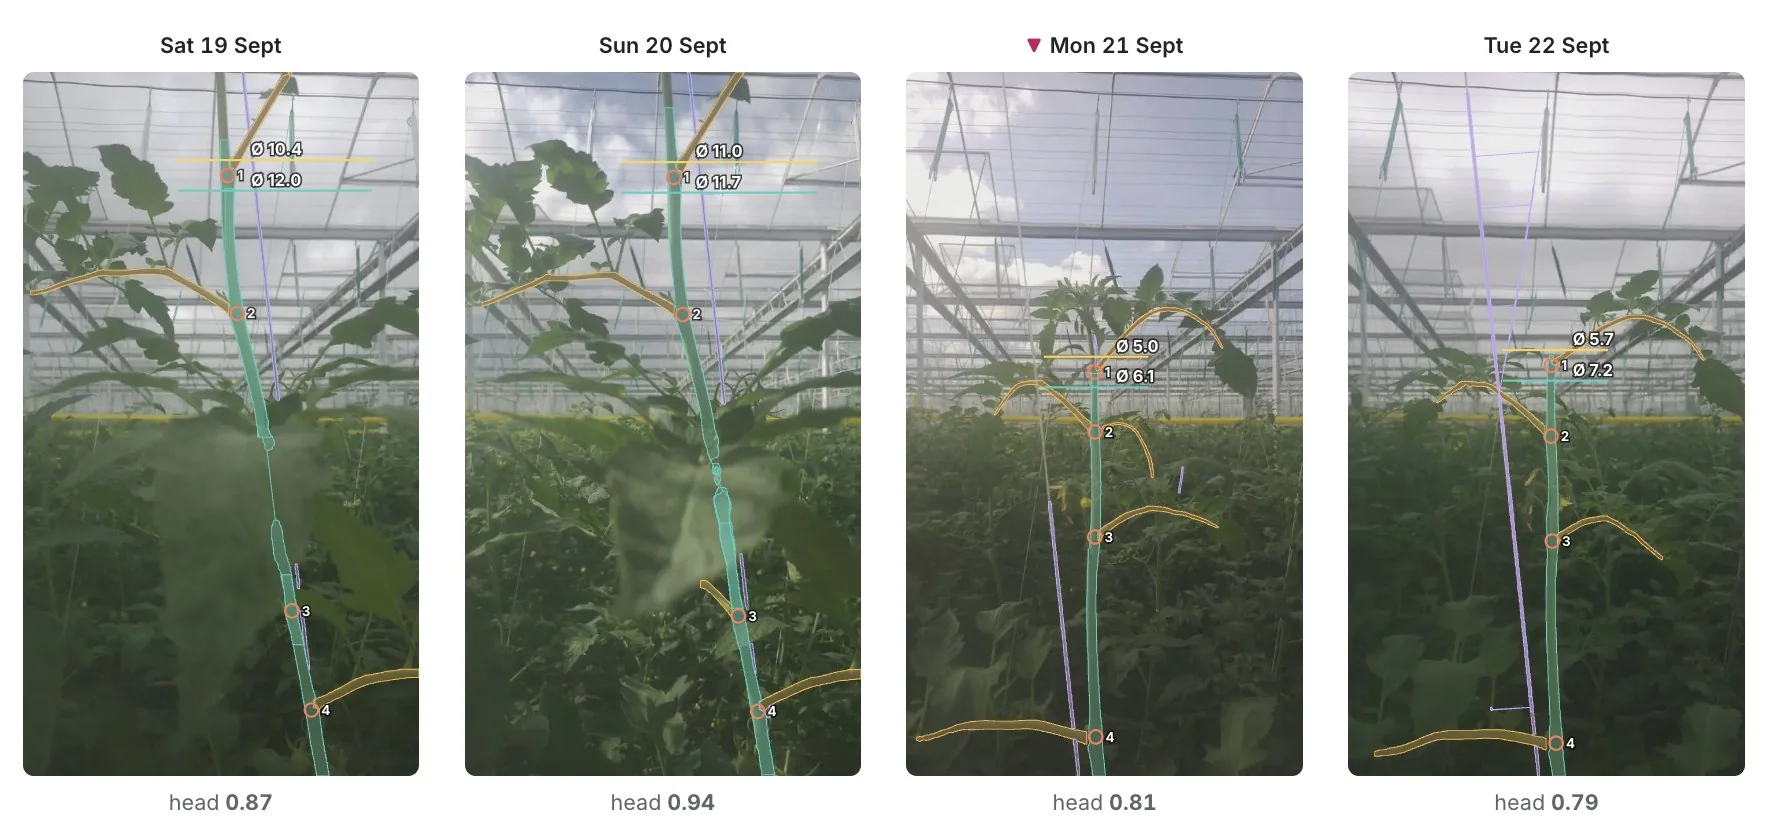
When the row is lowered the whole plant moves down in the picture. Scout follows the order of the plants along the row, so the lowering is recognised as lowering, not as a plant that suddenly shrank.
Same drive, more answers
No extra hardware and no extra route. The robot is already driving every row, so the same pictures can answer more questions about your greenhouse.
Every plant measured, every day, in your own greenhouse. Tell us about your rows and we prepare an offer.
Last updated: 19 November 2026
FRAVEBOT s.r.o., Purkyňova 127, 612 00 Brno, Czech Republic, company ID 17904919, registered at the Regional Court in Brno, file C 131946. We act as the controller for the website, business communications, recruitment, customer stories and app account administration described in this policy. Our role when processing personal data on behalf of a customer is explained in section 4.
Privacy questions: support@fravebot.com. Person responsible for data protection: Denisa Jágerová.
What this policy covers. This policy covers our website and analytics, business enquiries and communications, recruitment, customer stories, and personal data used to provide the FRAVEBOT app and products. Sections 2 and 3 describe website visits and business contacts; section 4 separately describes app accounts and greenhouse data. The remaining sections explain recipients, international transfers, security and your rights.
Our website is hosted on our own servers in the Czech Republic and Germany and is made accessible through Cloudflare Tunnel. Website traffic passes through Cloudflare’s network to our servers. Cloudflare processes technical data such as your IP address, browser information and requested URLs, as well as the contents of requests passing through the tunnel, including submitted forms, to provide this connection. We use this service to deliver the website and protect access to our servers.
Website operation and security. We process technical request data, including IP addresses, browser information and requested URLs, to deliver pages, maintain the availability of the website and protect it against misuse and excessive requests. The legal basis is our legitimate interest in providing a functioning, reliable and secure website, Art. 6(1)(f) GDPR. This operational processing is separate from optional analytics and does not depend on analytics consent.
Retention in our website application. Technical request data is processed to handle each request; routine access logging is disabled in our website application server. To limit excessive requests to our form endpoint, the application keeps IP addresses and request timestamps in working memory, not in the form database. Requests are counted over a rolling 60-second window. This is not a 60-second deletion period for the IP address: the in-memory entries remain until the application process ends or the limiter clears its entire list after it exceeds 5,000 entries. There is currently no separate time-based deletion of those entries. The retention period for submitted forms is described separately below.
Retention by Cloudflare. For personal data processed on our behalf, Cloudflare’s published Data Processing Addendum describes retention until the earlier of the expiry or termination of the service agreement, or the date on which processing is no longer necessary for the parties to perform their obligations under that agreement, to the extent applicable. It also provides for deletion or return of that data following termination or completion of the service, except where retention is required by applicable law. These are Cloudflare’s published contractual criteria, not a fixed retention period configured in our website application.
Cookies and similar technologies. We use a necessary cookie to remember your cookie choice. With your consent, we use Google Analytics (described below) to see which pages are opened, how long they are read and how visitors find our website. We no longer use any analytics of our own. Legal basis for analytics: your consent, Art. 6(1)(a) GDPR. The following item is set by FRAVEBOT on this website:
Google Analytics. With your consent, we use Google Analytics, loaded through Google Tag Manager, both provided by Google Ireland Limited. They show us how visitors find and use our website, for example which pages are opened, how long a visit lasts, the type of device and the approximate location. Advertising features and Google Signals are switched off. Google Analytics sets the cookies _ga and _ga_<ID>, which last up to 2 years. Declining stops Google Analytics and removes these cookies. Google processes this data under its ownprivacy policy.
Data on our server. Submitted forms are stored on our own server. We do not sell this data or use it for advertising. Form submissions pass through Cloudflare Tunnel as described above.
You can change your choice at any time with “Cookie settings” at the bottom of each page. Declining stops Google Analytics and removes its cookies. When fb_consent expires or is deleted, we ask for your choice again on the next page load and do not start analytics unless you accept.
LinkedIn. We have a company page on LinkedIn. When you visit or interact with it, LinkedIn processes your data under its own privacy policy. We see only statistics about our page and the comments and messages you send us.
Required and optional information. Providing information through our forms is not a legal obligation. We require your name, company and email address to identify who is contacting us, understand which business the request concerns and respond to your enquiry. The Scout request form also requires your greenhouse size in hectares to help us prepare a suitable offer. You cannot submit the relevant form without these required details. Other information is optional, including all fields within sections marked “optional”. It helps us better understand your needs and prepare a more specific response or offer. You can submit your request without this additional information; if we need further details, we will ask you afterwards.
Website submissions and follow-up communication. The 730-day retention period above applies only to copies of submitted forms stored on our website server. Deleting those copies does not automatically delete subsequent email correspondence, CRM records or contractual documents.
Replies to your requests. We use the contact details you provide through our forms to respond to your enquiry or request and for related follow-up communication. Our response depends on the information and needs you describe and may include an offer you have requested. We do not send marketing emails or newsletters, and submitting a form does not subscribe you to a mailing list.
We do not sell your data and we make no automated decisions about you.
Job applicants. If you send us your CV, we use it only for the hiring process, as a step before a contract, Art. 6(1)(b) GDPR. We delete it within 6 months after the process ends, unless you agree that we keep it longer.
Our role. We act as the controller for personal data used to administer app accounts, provide support and secure the service. Where we process personal data solely on behalf of a customer as part of providing our products, we act as a processor under that customer’s instructions and the applicable data processing agreement; the customer determines the purposes of that processing. Ownership of greenhouse data is a separate contractual matter and does not by itself determine these data protection roles.
App accounts (cloud.fravebot.com). For each user we keep name, email, phone (optional), company, role and login records. We use them to give you access, provide support and keep the app secure. Legal basis: performance of our contract, Art. 6(1)(b) GDPR, and legitimate interest in security, Art. 6(1)(f). We delete an account within 3 months after the contract ends and keep login records for 12 months.
Greenhouse data. Data that Scout and FRAVEye collect in your greenhouse is covered by your contract and our data processing agreement. It stays yours. Scout data is stored on a server in your greenhouse; results and selected photos go to the FRAVEBOT app. FRAVEye data is stored anonymised on our own servers in the Czech Republic and Germany. Our robots photograph plants and sticky traps, not people. Labour control checks the result of crop work on the plants, not the workers.
Journal and customer stories. We name a customer, or show their greenhouse data, in our Journal or on LinkedIn only with that customer’s consent.
Providers process data only on our instructions and under a written agreement. If FRAVEBOT is sold or merged, your data may pass to the new owner under the same conditions as in this policy.
Our website, website form database and CRM are hosted on our own servers in the Czech Republic and Germany. This describes our own hosting, not the processing locations of all external providers.
Website traffic passes through Cloudflare Tunnel, and our business email is processed through Google Workspace. Cloudflare, Google and their subprocessors may process the data needed to provide these services outside the European Economic Area (EEA), including in the United States. This can include technical data and the contents of website requests for Cloudflare, and contact details, messages and attachments for Google Workspace.
With your consent, Google Analytics data is also processed by Google, which may transfer it to the United States; Google LLC is certified under the EU–US Data Privacy Framework.
Under their published data processing terms, these providers use applicable European Commission adequacy decisions for covered transfers, including the EU–US Data Privacy Framework for transfers covered by the certifications of Cloudflare, Inc. and Google LLC. Where a transfer is not covered by an adequacy decision, their terms provide for the European Commission’s standard contractual clauses and supplementary safeguards where required. Details and the relevant contractual safeguards are available in the Cloudflare Data Processing Addendum, the Google Cloud Data Processing Addendum (including Google Workspace) and Google’s transfer-mechanism information. You can also request further information and a copy of the relevant transfer safeguards by writing to support@fravebot.com.
Our website, website form database and CRM run on our own servers in the Czech Republic and Germany. External services such as Google Workspace and Cloudflare Tunnel are described above. Connections are encrypted, access is limited to people who need it and protected by login, and we keep backups.
You can ask us to:
Withdrawing consent. Where we process your personal data based on your consent, you can withdraw that consent at any time, free of charge. Withdrawal does not affect the lawfulness of processing based on your consent before it was withdrawn. To withdraw consent to our website analytics, open “Cookie settings” at the bottom of any page and select “Decline”. For other consent-based processing, such as keeping your CV for longer after a hiring process, write to support@fravebot.com and tell us which consent you wish to withdraw.
You can also object at any time to use based on our legitimate interest, including handling enquiries and communicating about our cooperation. Write to support@fravebot.com; we reply within one month.
If you think we handle your data wrongly, you can complain to the Czech data protection authority: Úřad pro ochranu osobních údajů, Pplk. Sochora 27, 170 00 Praha 7, uoou.gov.cz.
We update this policy when the way we use personal data changes. The date at the top shows the latest version.
Sales manager · Europe and worldwide
papadakis@fravebot.com
Sales consultant · The Netherlands
pierre@grootscholtenconsultancy.nl
Solution engineer
nedved@fravebot.com